
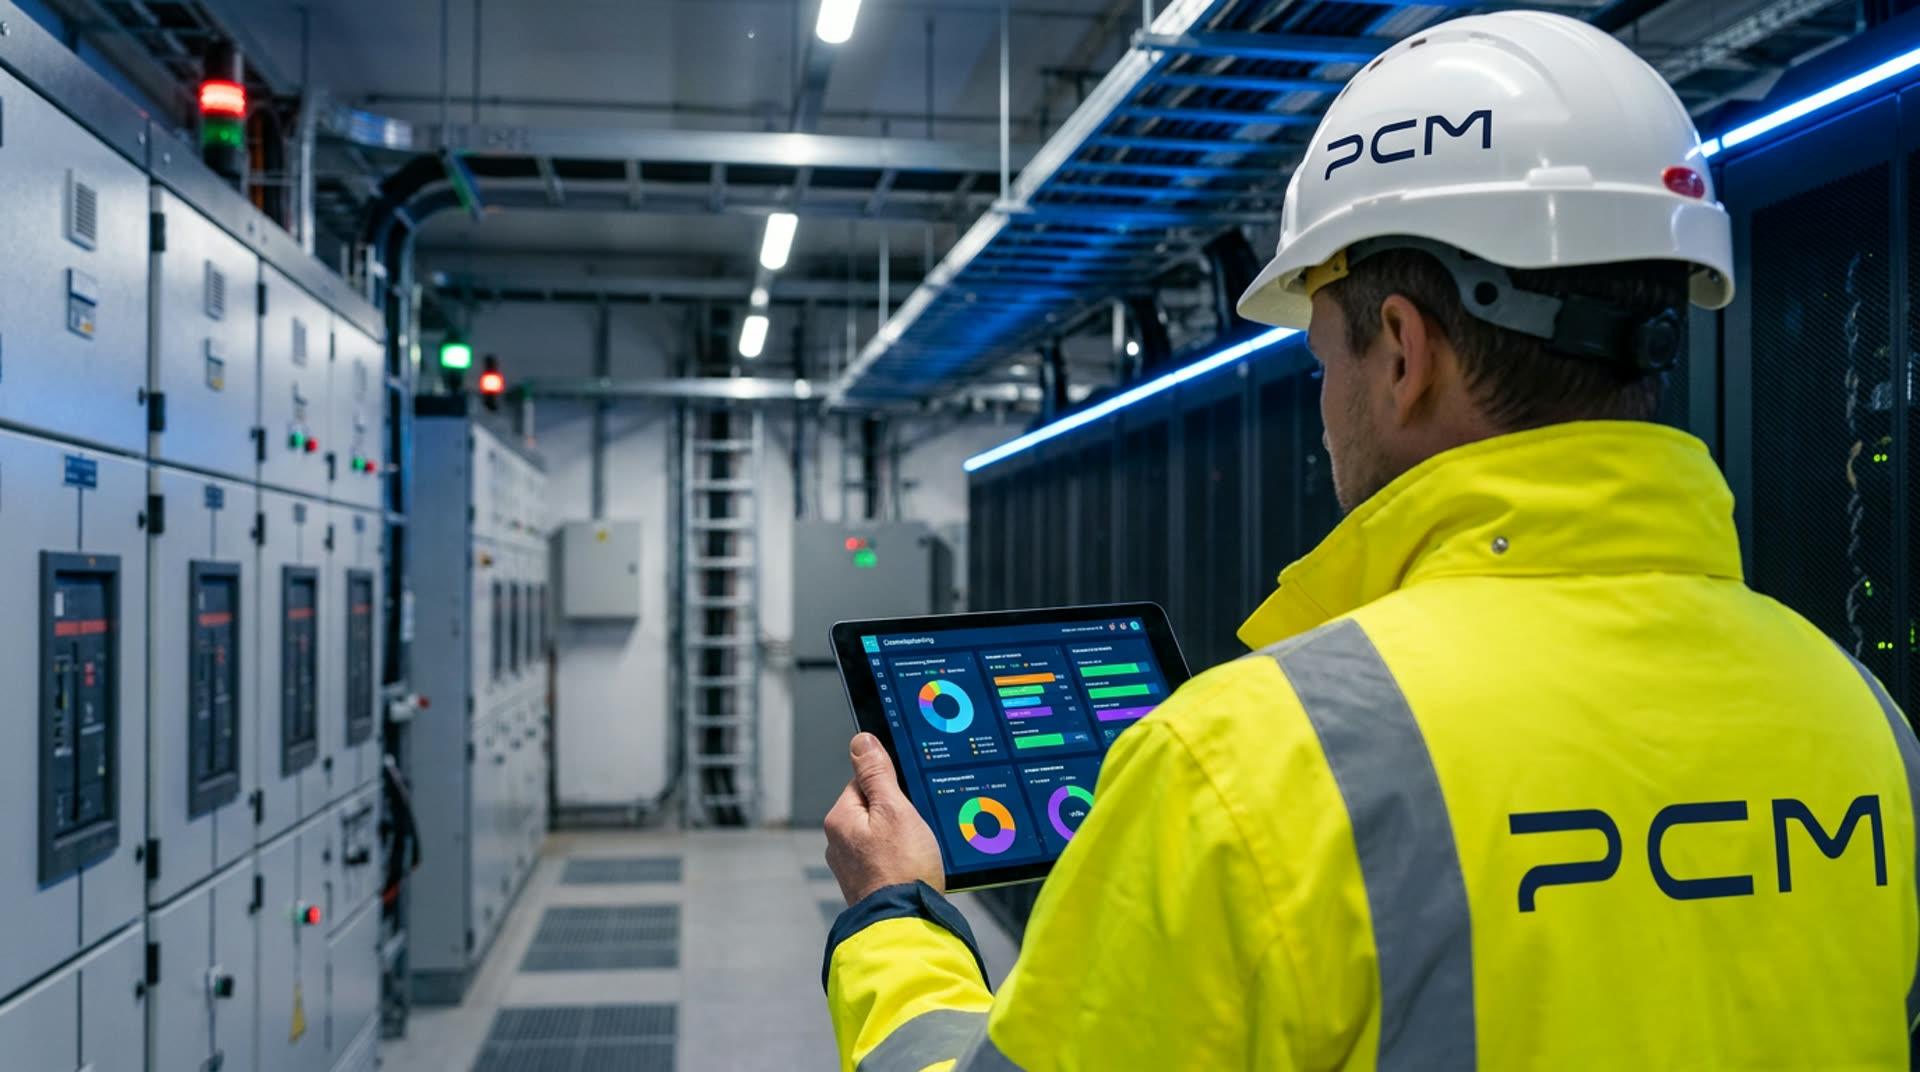
Live-streamed handover.
No wait times on progress reports. Access your system's operational readiness score at any second — every chiller, sensor, and switchboard, visible to your team.
Try the portal — click any check to explore.
Real commissioning data from the Tower B DC-04 sample project. Toggle stages, watch the readiness gauges recalculate live, and see the CIBSE progress rail, S-curve and activity feed update in real time.
Tower B — Mission Critical Node DC-04
Live PCM Client Portal walkthrough on a representative commissioning dataset — drag the stage sliders or click any cell to adjust completion and watch the readiness gauges update in real time.
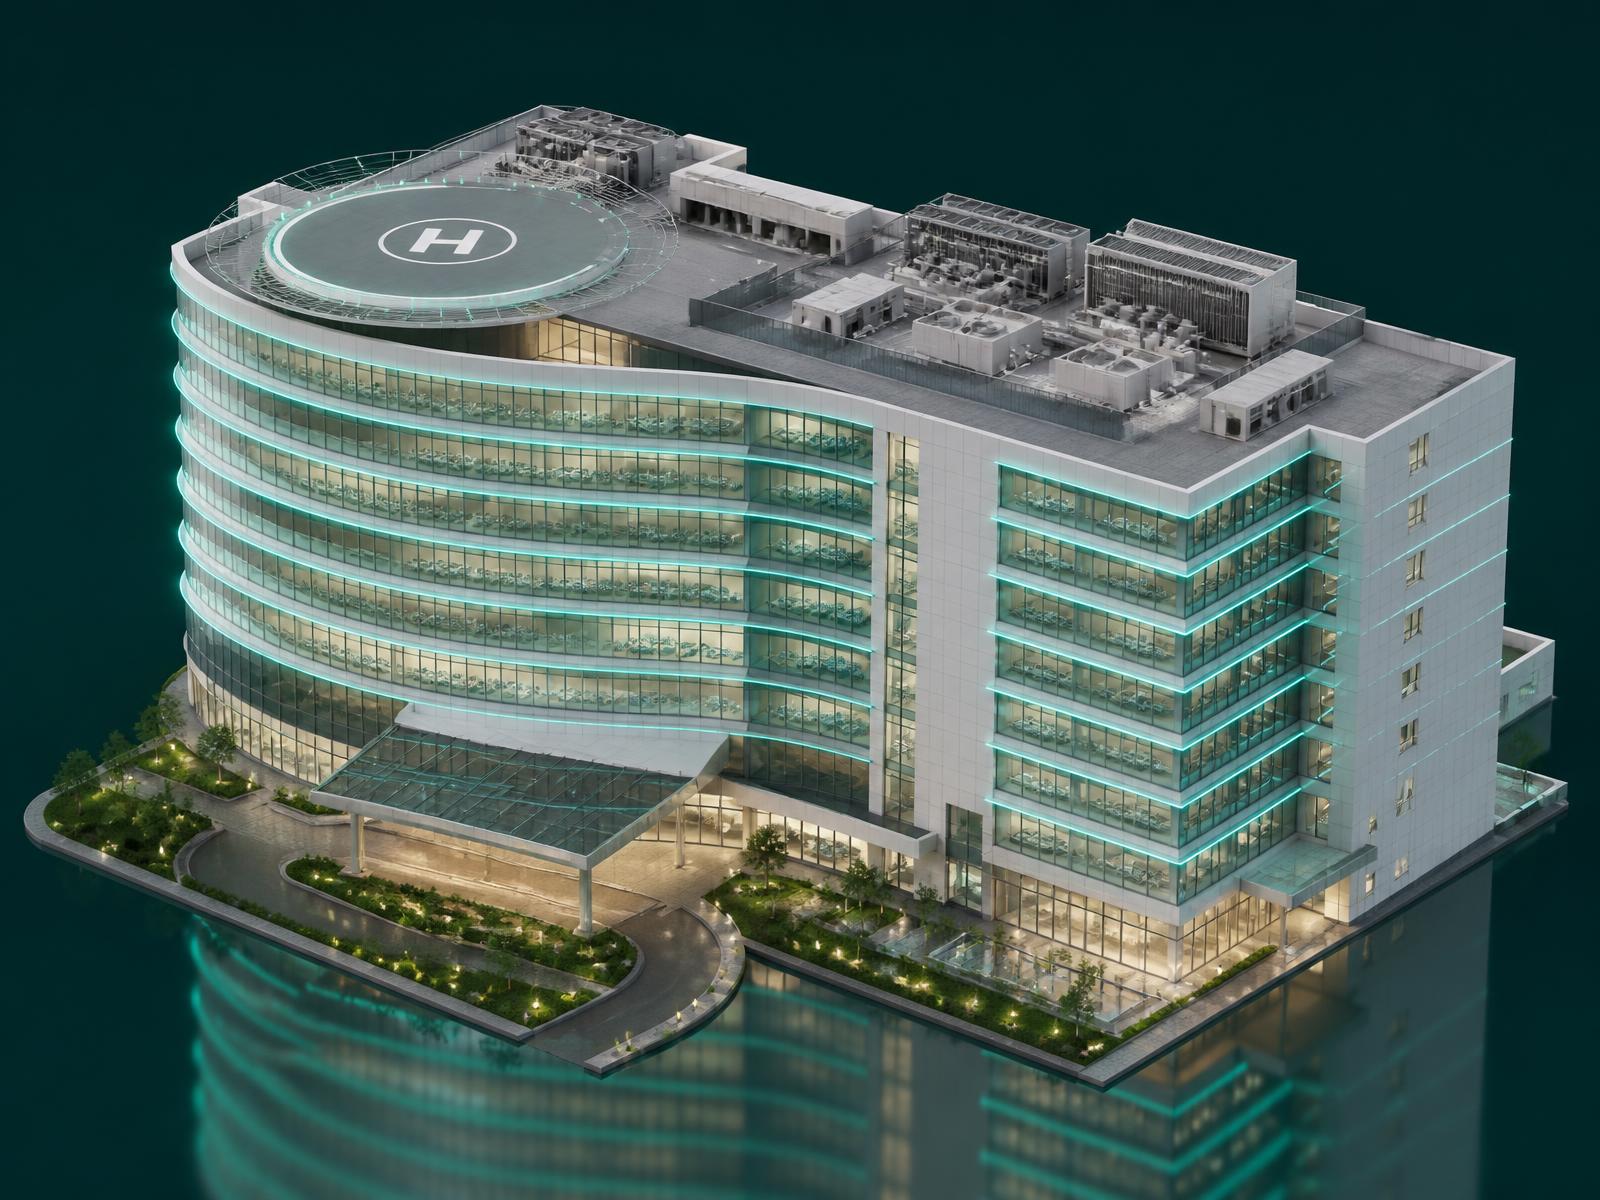
Every final test, on the building.
Building flushing, overall balancing, BMS functional testing, IST, black start, emergency scenarios and fire system connection — mapped onto the building render with a live readiness percentage. Hover or click any marker.
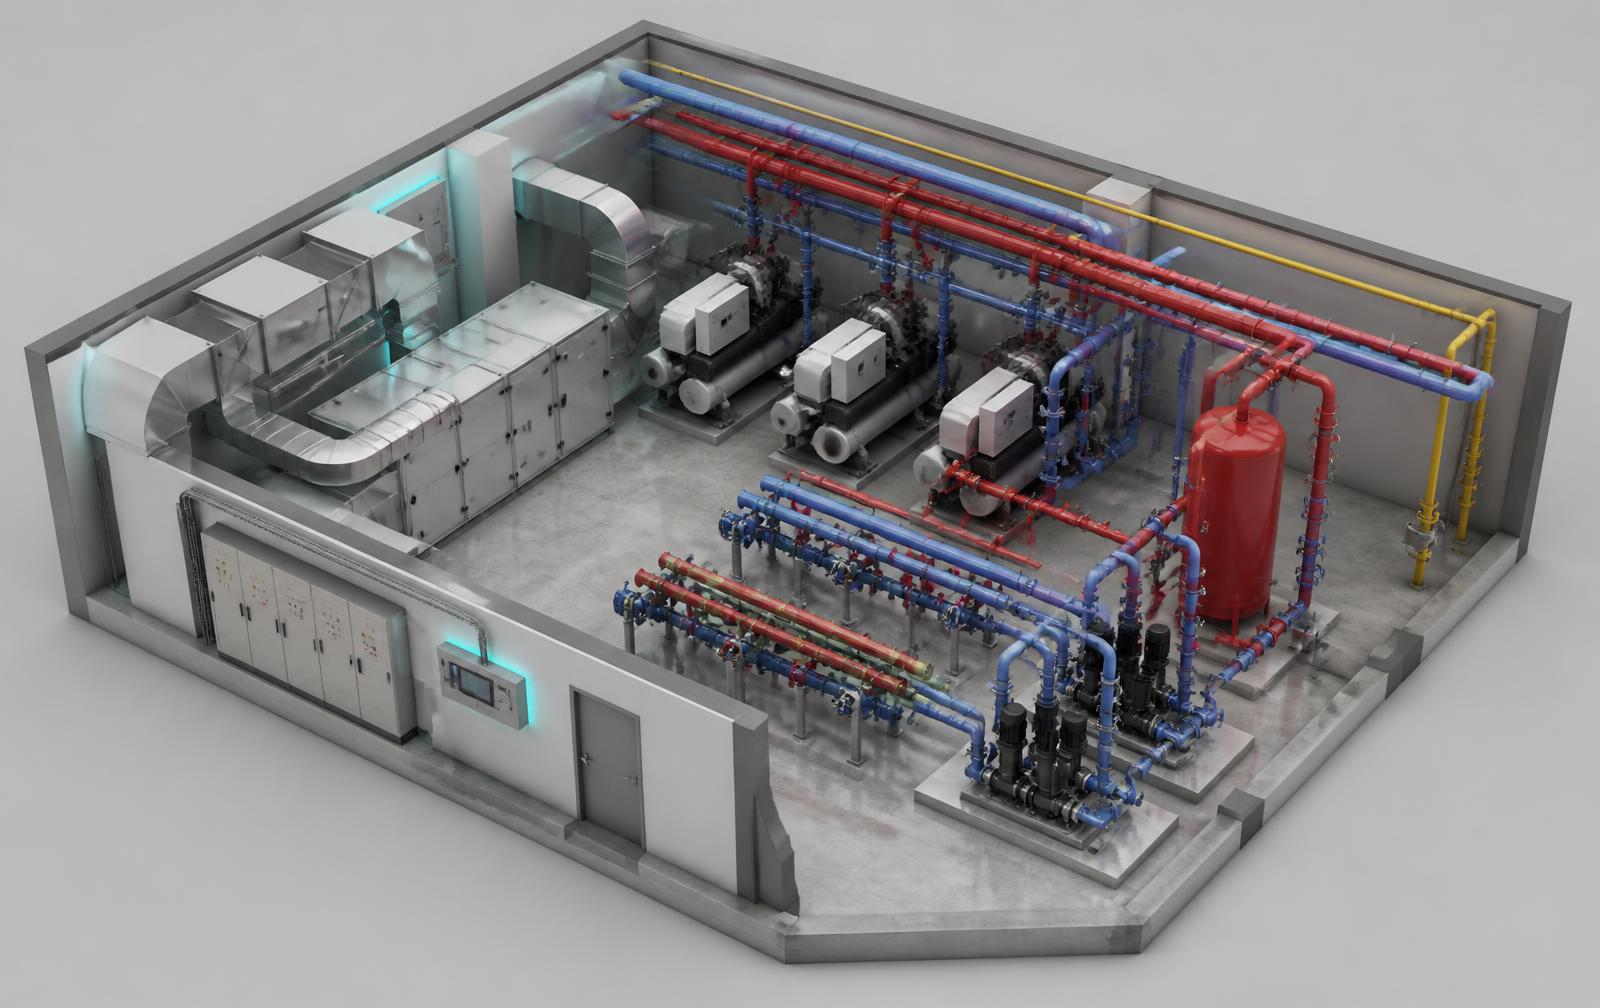
Your plantroom, live — every asset status on the model.
A federated 3D model view of the central plantroom with commissioning status highlighted on each asset. Click any chiller, pump, AHU, switchboard or header to see its readiness, open defects and witnessing notes.
Water-cooled chillers
Mechanical
Static, pre-Cx and integrated controls witnessed. Duty/standby changeover proven at full load.
The 12 months after handover, evidenced.
We ingest exported BMS trend logs and run seven automated diagnostics over them — simultaneous heating and cooling, after-hours running, economiser faults, short cycling, sensor drift and more. Every finding lands in a tuning register with a recommended action, ready for Green Star and NABERS evidence. Click any finding below to see it on the trend.
Highlighted band shows the selected finding: Simultaneous heating and cooling on AHU-01 HTG-VLV / CLG-VLV.
Tuning register
click a findingHeating valve held at 38% while the cooling valve ran above 60% for 4.5 hours on eight of the last ten days.
Re-sequence the AHU valve control loop with a dead-band between heating and cooling, and verify the discharge air setpoint reset schedule.
Diagnostic and read-only. PCM ingests exported BMS trend logs and reports what it finds — the platform never writes setpoints or sends commands to building plant.
Want to see the full portal?
This is a small sample. The full PCM Client Portal — live progress, defect logging, filtered reporting and CIBSE Code M workflow — is shown in a private walkthrough with our team.
Get in touch for a walkthrough →Live Completion Dashboard
A clean, visual breakdown of system readiness — view progress by discipline: HVAC, electrical, controls, fire & life safety.
Real-Time Witnessing Logs
Secure, date-stamped logs of static, pre-commissioning, and dynamic testing with uploaded visual verification.
Active Punch-List Management
Open defects categorized by priority, responsible party, and impact on critical-path testing.
Digital Document Library
Instant access to signed checklists, Factory Acceptance Tests, method statements, and O&M handovers.
See the portal on your live project data.
A 20-minute walkthrough on the system of your choice.