
PCM — Independent Commissioning Agent & Commissioning Management Australia-wide
Contact
For Developers · Independent Commissioning
PCMPCM / Developers

What we do for developers.

From feasibility to twelve months after handover — we protect your occupation certificate date, your defect exposure and the energy performance your numbers were built on. Then you can check those numbers yourself.

What we do for developersFeasibility to year one

One independent team accountable for the building actually working.

We are your independent commissioning agent — not the contractor, not the designer. Everything we do protects three things a developer is judged on: the date, the asset and the numbers.

Protect the date

Your occupation certificate holds.

  • Commissioning programme built backwards from the OC and tenant handover dates
  • Critical tests — flushing, IST, BMS, fire integration — tracked week by week
  • Defects raised and closed on site, not stockpiled for the last fortnight
Protect the asset

The building is proven, not just finished.

  • Commissionability and plant-space review before the design is locked
  • Commissioning scope written into the trade packages so nobody prices it out
  • Independent witnessing across mechanical, electrical, hydraulic, fire and BMS
Protect the numbers

The performance your feasibility assumed.

  • Evidence packaged for Green Star, NABERS and lender reporting
  • Twelve months of building tuning against real BMS data
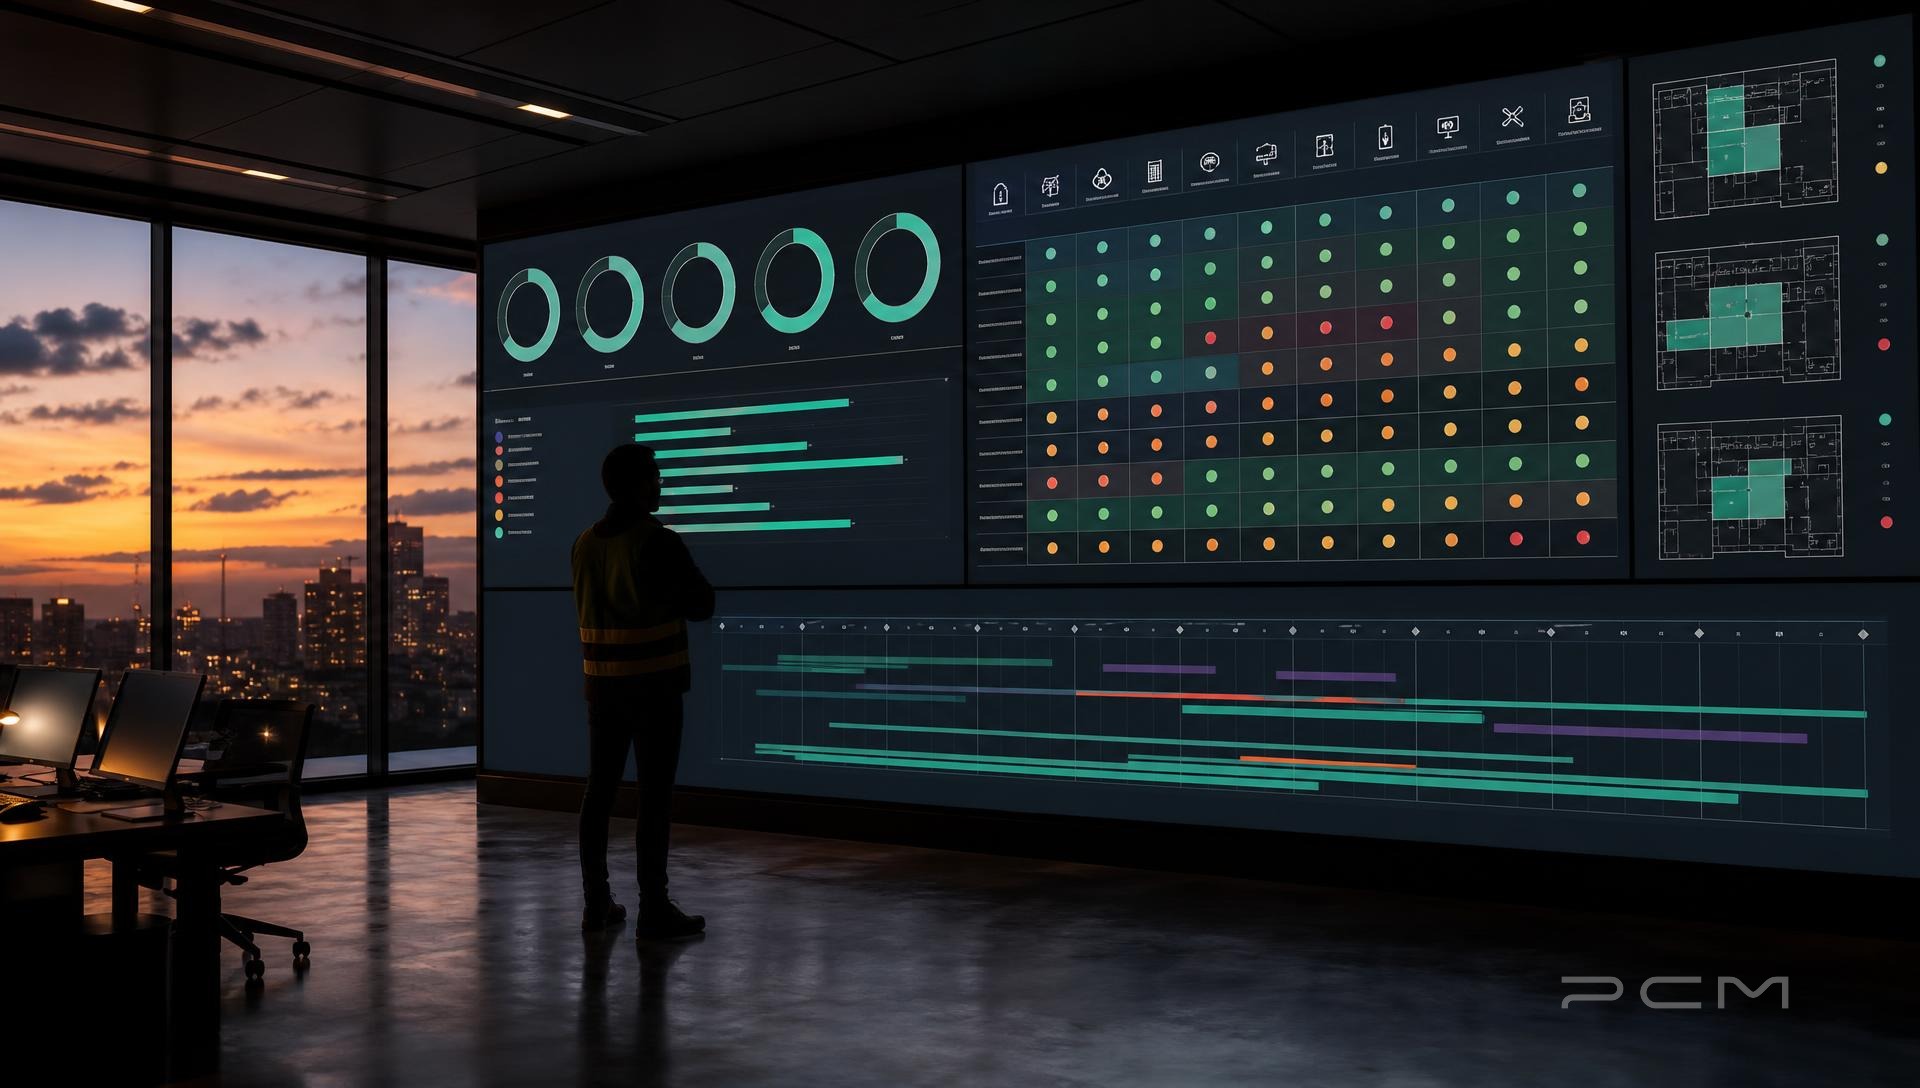
  • Live handover visibility — you watch completion build floor by floor
PCM command wall showing live commissioning completion by discipline and floor
Your team sees the same live completion data we do — discipline by discipline, floor by floor.
Where we come in

Engaged early, still there twelve months after handover.

  1. 01

    Feasibility

    Plant, space, programme and ESG sanity-check

  2. 02

    Design

    Commissionability review and Code M strategy

  3. 03

    Procurement

    Commissioning scope written into packages

  4. 04

    Construction

    Independent witnessing and live tracking

  5. 05

    Handover

    Occupancy readiness and defect closeout

  6. 06

    12-month tuning

    Seasonal tuning and performance evidence

Feasibility assistance

Test the scheme before you commit the capital.

Most services problems are priced in long before site starts. We sit with your team at concept stage and pressure-test the assumptions the feasibility rests on — plant space, cooling load, programme and the ESG outcomes underwriting your NLA and yield.

  • How much plant room and riser area the scheme really needs
  • Indicative cooling load, slab loads and plant massing
  • Realistic commissioning duration inside your programme
  • Annual energy and ESG savings the strategy can defend

Benchmarked against CIBSE Guide A, BSRIA operational databases and Australian utility data — then validated by the commissioning team who will actually prove the building.

Run the numbers
PCM team reviewing a development feasibility appraisal with plant and programme data on screen
Live toolDeveloper Feasibility Hub

Check your project.

Pick a sector, enter your GFA and layer in ESG systems. In under a minute you get indicative plant room area, cooling load, slab loads, commissioning weeks and annual energy savings — enough to test a scheme before design is locked. Calculations reference CIBSE Guide A, BSRIA operational databases and Australian utility benchmarks.

Feasibility Sizing Platform

Developer Feasibility Hub

Estimate plant footprints, cooling infrastructure and commissioning schedule durations to support your early-stage commercial appraisals — sized to Australian benchmarks.

12,000 m²
1,000 m²100,000 m²
Sector Specifics

High-density tenant profiles requiring careful ventilation balancing, variable air volume (VAV) control, and NABERS compliance.

*Space allocation and load guidelines conform to CIBSE Guide A and BSRIA operational databases [1.1.2, 1.2.6].
Space Footprints
Estimated Plant Room Area720 m²
Slab Load Allowance7.5 kN/m²
Net Lettable Area (NLA)11,280 m²
Schedule & Utility Loads
16 Weeks
Estimated Cooling Infrastructure1,320 kW (375.3 TR)

Commissioning timeline includes planning, dynamic water balancing and integrated systems testing — across 6 CIBSE stage gates.

ESG Appraisals

Sustainable Systems & ESG Savings Estimator

Select high-performance building systems to evaluate carbon offsets and operational savings — sized to your GFA using Australian utility rates.

Estimated Savings / Year$150,528 / yrAcross 32% of baseline utility cost.
CO₂ Offset Estimate
376.3 tCO₂ / yr
Baseline Annual Utility Cost
$470,400

Calculations use the average Australian commercial electricity rate of $0.28/kWh and an emissions factor of 0.70 kgCO₂/kWh.

Applying Early-Stage Feasibility Best Practices

Establishing plant footprints and structural allowances during the conceptual feasibility phase avoids significant spatial conflicts and expensive post-contract design revisions.

How we engage with developers

Your independent voice on the project.

Contracted directly by the developer or asset owner as the Independent Commissioning Agent (ICA), we sit on your side of the table — collaborating with the builder, reporting back to you without filter.

Reporting line
  1. Developer / Client
    Asset owner — our principal
  2. PCM — Independent ICA
    Owner-side advocate
  3. Main Contractor & MEP Trades
    Delivery partners we collaborate with
We work with the builder. We answer to you.
Independence · 100% owner-side

Developer-direct (ICA role)

As your Independent Commissioning Agent we witness, review and sign off the builder's testing and handover — protecting your investment, validating performance against the brief and securing Green Star and NABERS credits.

  • › One contract, one reporting line — direct to the owner.
  • › No design or installation conflicts of interest.
  • › Evidence-based assurance from feasibility to operation.
Contractual alignmentOwner-side, every time
Lifecycle Estimator

Operational lifecycle & energy savings.

Model the projected annual energy savings, carbon offset and protected operational value a structured PCM handover delivers across your asset's footprint and sector.

Interactive Estimator

Operational Lifecycle & Energy Savings Calculator

Evaluate your optimal commissioning timeline and long-term sustainability yields based on building footprint and sector.

10,000 m²
1,000 m²100,000 m²
4 Weeks
1 Week12 Weeks
Projected Annual Energy Savings$35,000 / yrBased on 18% average HVAC/BMS tuning optimization.
Carbon Offset Estimate
150 tCO₂ / yr
Suggested Handover Programme
14 Weeks

Structured timeline de-risks testing phases. Parallel milestone gate-tracking verifies systems without final schedule compression.

Protected Daily Operational Value$959 / day

Maintaining a stable 4-week handover schedule protects $26,852 in operational value.

Request Tailored Handover Programme
Why it matters to a developer

Numbers we're hired to protect.

Certificate of occupancy on time, fewer defects at handover, evidence ready for Green Star and NABERS, and tenant handover dates that hold.

Year-one energy reduction
18%
Programme recovered at handover
3 wks
Green Star / NABERS credits secured
5★

Bringing a development forward? Start the conversation early.

Whether you need a feasibility sanity-check or an independent commissioning agent for the whole build, we can pressure-test your plant, programme and ESG strategy against real Australian project data.

Talk to a commissioning lead